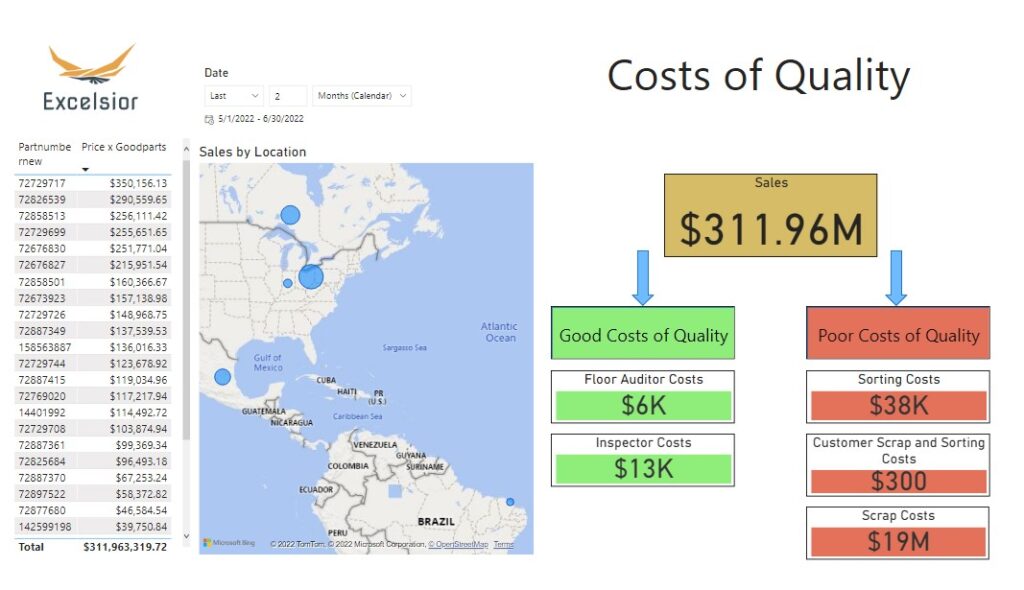
This is a Cost of Quality dashboard I created to breakdown some of the costs interactively.
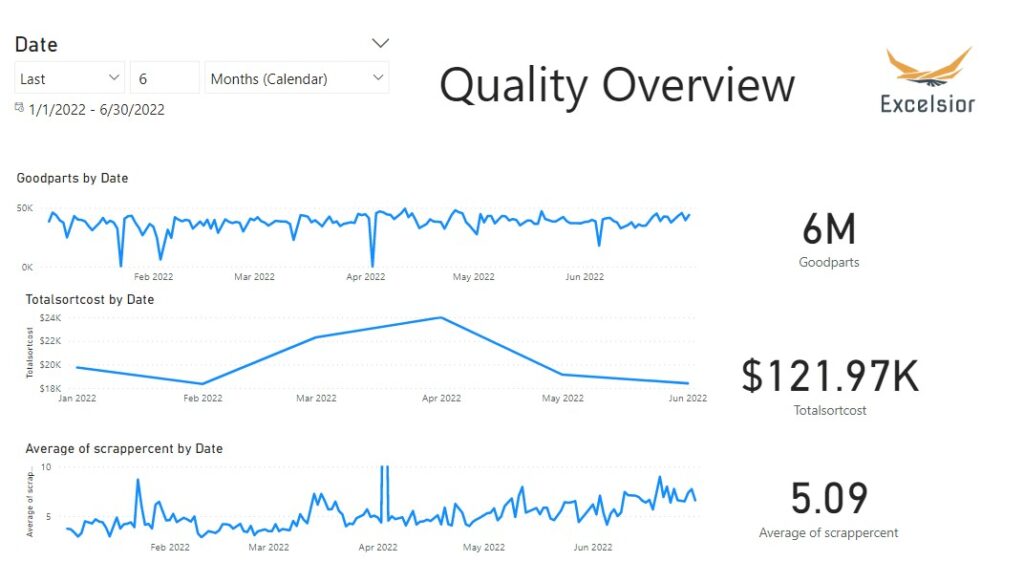
Here is a live dashboard I created for Quality metrics. As different nodes in the system update, so will this live. It’s a top level view of the Quality system so I can better steer the ship.
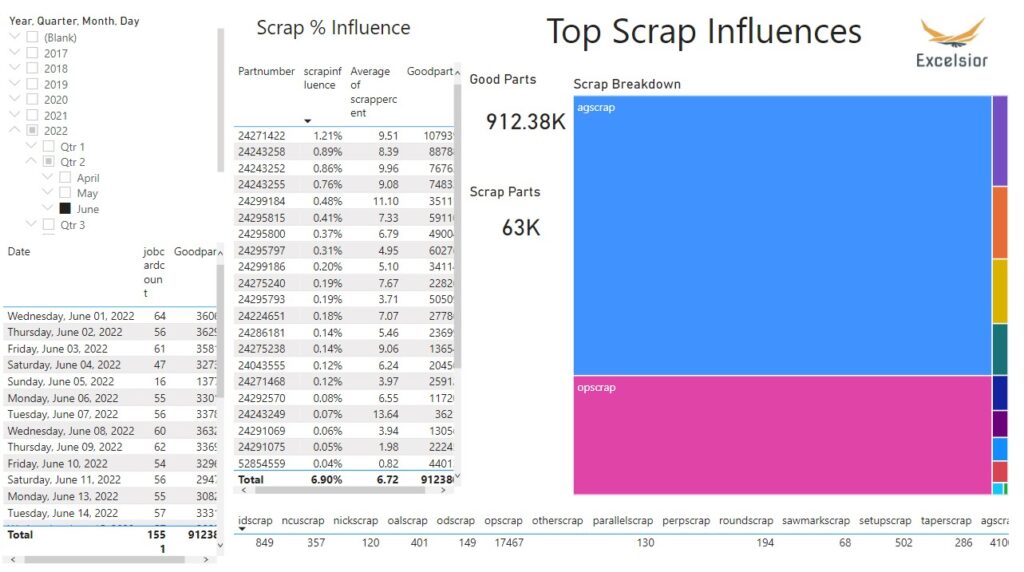
Here Im drilling into the defect records to look for root cause. Lots of speculation and heresy, but systems cannot be built or run with rumors.
This system is built to allow all levels of the quality system to be working together. Spend more time on what matters and less time looking for data.
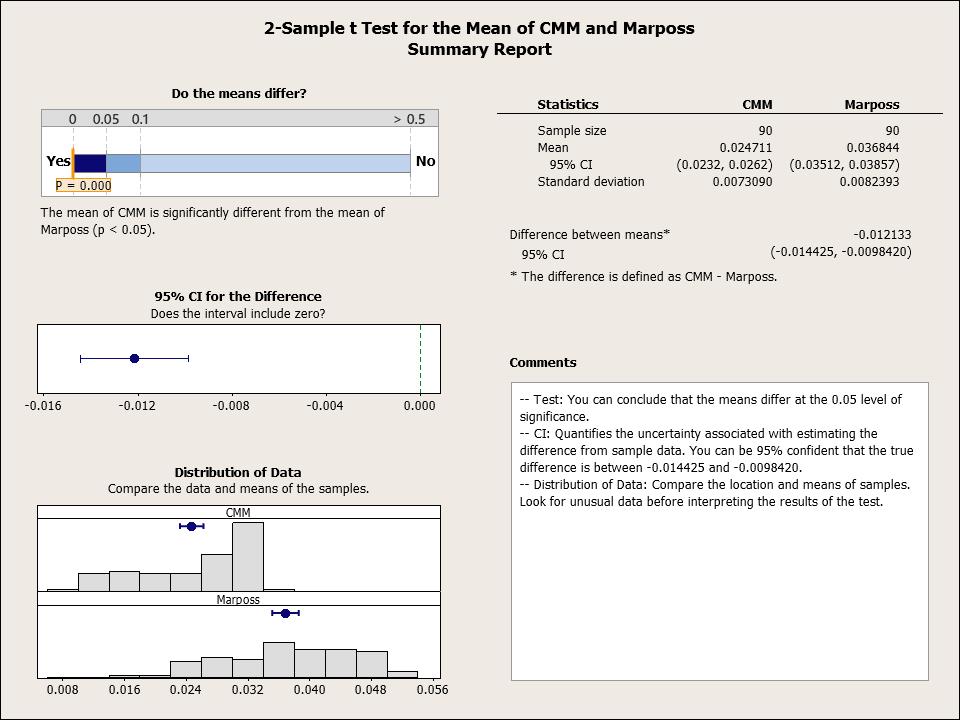
I am well versed in Measurement Systems Analysis.
This is a problem I encountered while launching a new project. The 2 systems had different readings. To rule out opinions I statistically studied the 2 systems. The CMM shows a truncated like distribution. After investigation, it was discovered that this measurement system was not properly measuring a hole. The method was fixed, and the problem solved.
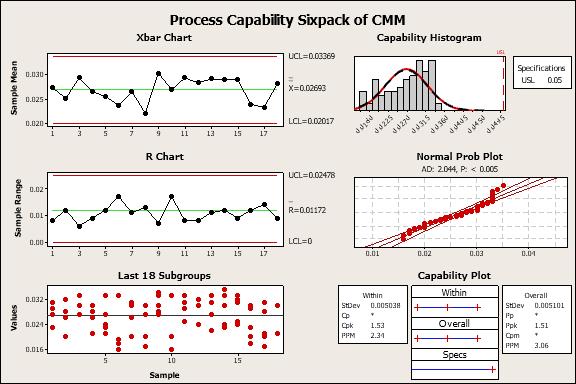
Here I am evaluating a process performance. The process fell short of how the process was designed to do. It was designed to achieve a 1.67 Ppk. Looking at the data, you can see anomalies in the Histogram and the Probability Plot. The cause for this was discovered after some investigation. The process operators were throwing away high reading parts for this dimension and that caused the charts to look like this. So, the study does not reflect the real process and should be ran again after any correction.
People can be taught to just look at numbers, but understanding the process takes experience.